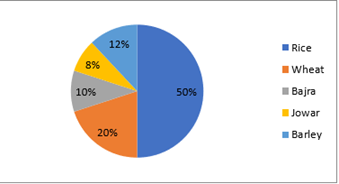
| Q.46 | The given pie chart shows the distribution of land under various food crops. The expenditure invested on these food crops is ₹25,000 per annum. Study the pie chart carefully and answer the question that follows.
The expenditure invested in Rice and Barley is what percentage (correct to 2 decimal places) of the expenditure invested in Wheat and Bajra? | |
| Ans | 1. 206.55% | |
| 2. 260.66% | ||
| 3. 260.55% | ||
| 4. 206.66% |
Correct Ans Provided: 4